This is related to ticket #1407, a question about integration of COBOL applications in Elastic Batch Platform (EBP). This process is described in the EBP, JCL and Scheduler forum and the EBP / JCL Integration with Elastic COBOL article.
New: See Debugging Batch Programs later in this article for features about how to attach and debug a COBOL program running under the Job Entry Subsystem.
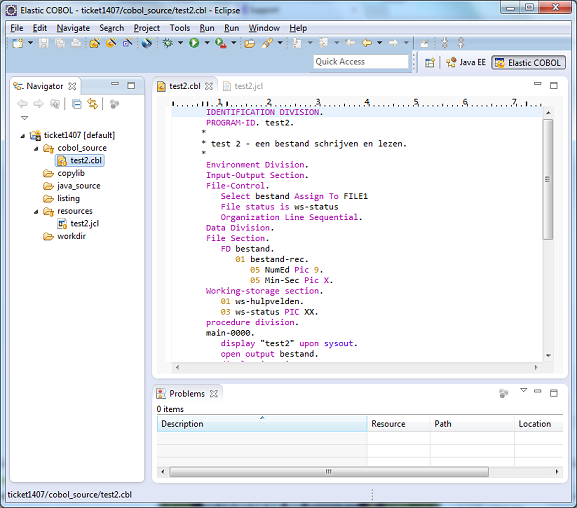
The Elastic COBOL project consists of a single program and JCL Deck TEST2. In the Elastic COBOL IDE the look like:
Fig. 1.
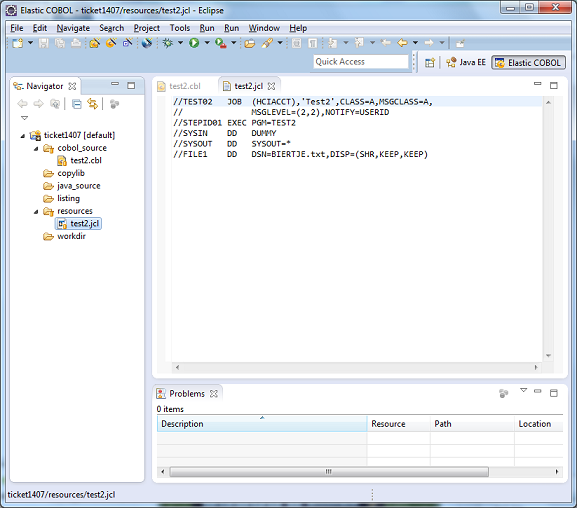
and the JCL deck:
Fig. 2.
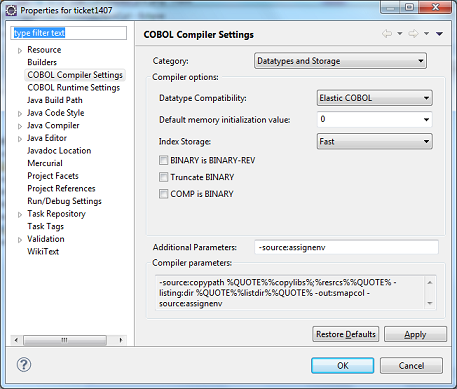
Normal Elastic COBOL settings are in force, with the additional -source:assignenv setting that will make the ASSIGN TO clause of the SELECT statement be associated with a DD name within the JCL deck.
Fig. 3.
The test2.cbl file is below:
Table 1.
       IDENTIFICATION DIVISION.
       PROGRAM-ID. test2.
      *
      * test 2 - een bestand schrijven en lezen.
      *
       Environment Division.
       Input-Output Section.
       File-Control.
          Select bestand Assign To FILE1
          File status is ws-status
          Organization Line Sequential.
       Data Division.
       File Section.
          FD bestand.
             01 bestand-rec.
                05 NumEd Pic 9.
                05 Min-Sec Pic X.
       Working-storage section.
          01 ws-hulpvelden.
             03 ws-status PIC XX.
       procedure division.
       main-0000.
          display "test2" upon sysout.
          open output bestand.
          display 'open' ws-status upon sysout.
          move 5 to NumEd.
          move "a" to Min-Sec.
          write bestand-rec.
          display 'write' ws-status upon sysout.
          close bestand.
          display 'close' ws-status upon sysout
          display "pass" upon sysout.
          move 0 to NumEd.
          move " " to Min-Sec.
          open input bestand.
          display 'open' ws-status upon sysout.
          read bestand.
          display 'read' ws-status upon sysout.
          if NumEd = 5 and Min-Sec = "a" then
             display "pass" upon sysout
          else
             display "fail" upon sysout
          end-if.
          close bestand.
          display 'close' ws-status upon sysout.
       end program.
The JCL file is:
Table 2.
//TEST02   JOB  (HCIACCT),'Test2',CLASS=A,MSGCLASS=A,
//              MSGLEVEL=(2,2),NOTIFY=USERID
//STEPID01 EXEC PGM=TEST2
//SYSIN    DD   DUMMY
//SYSOUT   DD   SYSOUT=*
//FILE1    DD   DSN=BIERTJE.txt,DISP=(NEW,KEEP,KEEP)
The EBP environment for this test must be set up to include the test2.jar executable JAR file (main class identified as test2), the file BIERTJE.txt will be created (if FILE1 DD is DISP=NEW) or must exist in advance (if FILE1 DD is DISP=SHR) in one of the datalib configuration settings of EBP.
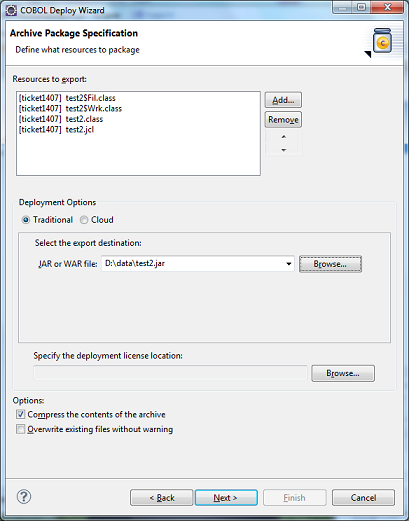
the Export Wizard is used to create the JAR file. The first window is used to enter the destination jar file name:
Fig. 4.
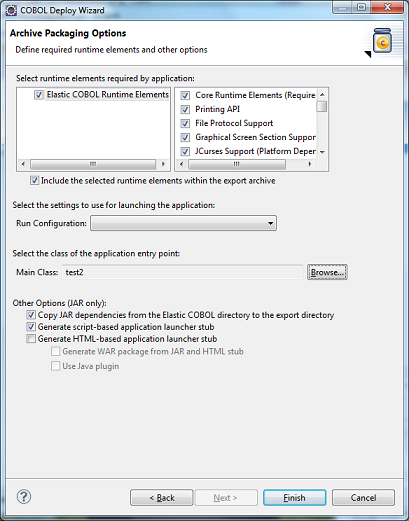
and the "main class" of test2 is chosen on the second dialog box window:
Fig. 5.
EBP looks for executables in the systemlib configuration settings. Additional (dependent) jar files may be defined in the classlib configuration setting. Remember that includes the ecobol.jar and etrans.jar files (not the directory containing the files, but the files themselves -- they can be specified together on a single classlib separated by a colon). New files are created in the first writable datalib configuration setting. One default for these on Linux is /data and on Windows d:\data. This same directory must be given on the systemlib so the program can be executed out of it. Thus, the export wizard picture above shows the file being exported to d:\data\test2.jar.
Note: You can configure EBP to have alternative directories for the datasets and the programs. Change the DataLib1 and the SystemLib2 settings to include your directory paths
Fig. 6.
Since the JCL indicates DISP=SHR for the FILE1 DD name it must be created in this same directory with appropriate read/write permissions. Alternatively, change the JCL to specify DISP=NEW to create the file in the first datalib EBP configured directory with read/write permissions.
Important: The user ID of the servlet engine hosting EBP (e.g., Tomcat, Websphere, JBOSS, etc) may be different than the owner of this directory. Make sure that the directory and file permissions allow any user to read or write the contents.
Fig. 7.

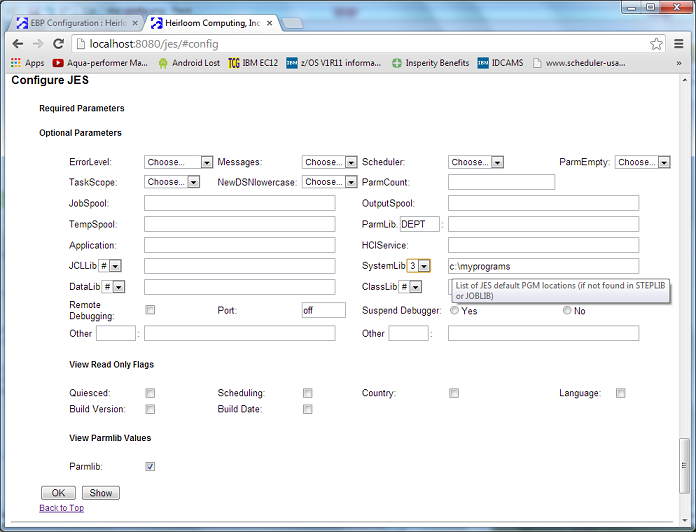
The EBP console is used to define a class A job class and start its initiator. Once the servlet engine or application server is started, the EBP console is available from the URL http://localhost:8080/jes
Note: All default EBP configuration settings were used for this test.
Fig. 8.

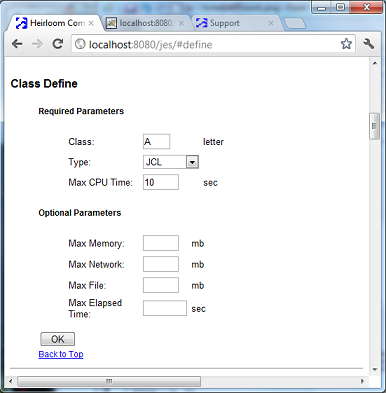
Define a new job class with the define Web service:
Fig. 9.
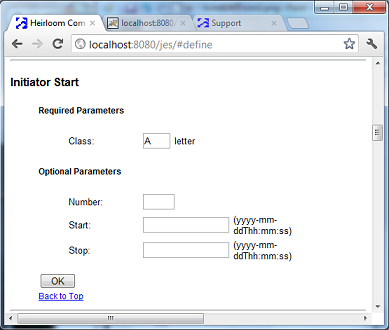
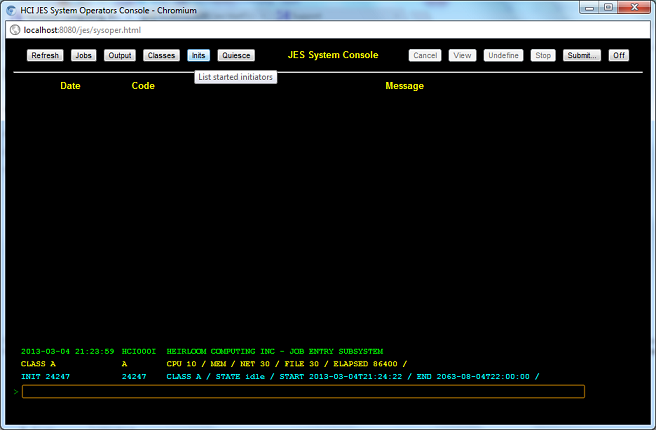
Start an a job class initiator with the start Web service:
Fig. 10.
Switching now to the EBP System Console (link available on the home page of the EBP console), the view of the system at this point is:
Fig. 11.
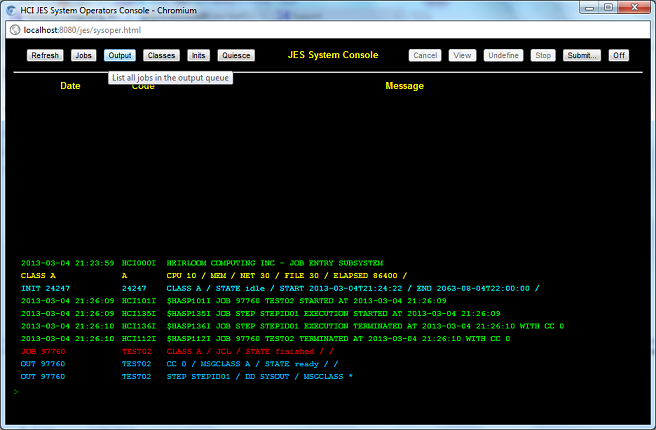
The JCL deck can now be submitted to EBP. Submit it with either the submit Web services console or the EBP system console Submit button. The result is shown on the system console (with the Jobs and Output buttons showing the results):
Fig. 12.
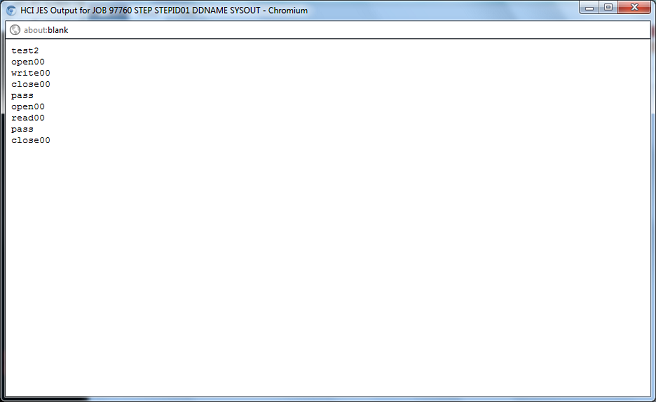
Selecting the two output datasets in the window and using the View button reveals the contents of the message class dataset (JCL execution engine output) and the output from the program itself:
Fig.13.
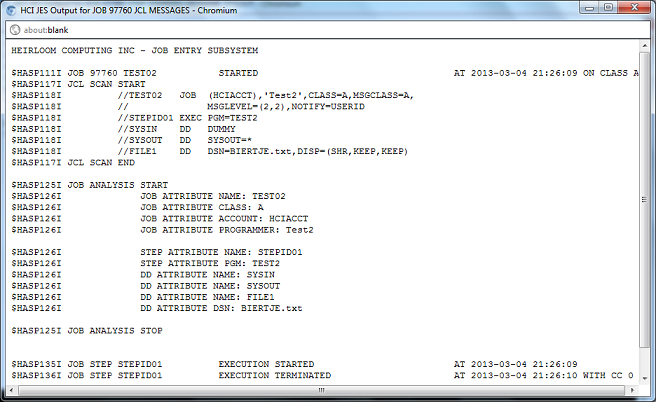
Fig. 14.
The directory now shows the size of the text file as being non-zero:
Fig. 15.
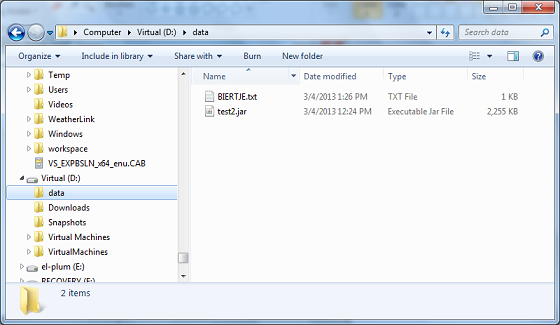
and the contents of the file reflect what was written by the program:
Fig. 16.

Debugging Batch Jobs
You've always been able to Cancel a runaway batch job in the EBP System Console before its EBP Class CPU or elapsed time restrictions have been exceeded. You can diagnose the issue by attaching to the job from the Eclipse debugger.
Many batch programs can be debugged directly from Eclipse as Debug As A ... COBOL Program . If file descriptor files are attached with environment variables, the operating environment will be the same as a batch environment. But, there may be reasons why you need to debug a batch program when it is initiated from EBP. To do so, use the EBP configuration settings and check the Remote Debugging checkbox.
Fig. 17.
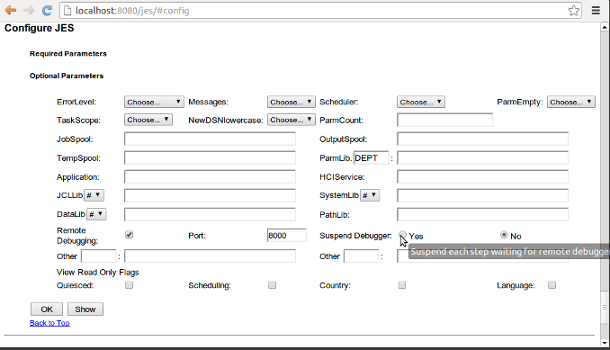
The Port input field will be set up with a default 8000 port number. Use this from Eclipse to attach to the EBP system's host name or IP address and this port number. All job steps are subject to debugging. The port number represents the first port number of the first job executing. If there is another concurrent job running (a second initiator of the same or different EBP class) it will be assigned the next available port number, 8001. Any number of concurrent jobs may be running and you may debug any of them.
Another setting is labeled Suspend Debugger with radio buttons Yes and No. If you wish to use the remote debugging facility to attach to long-running jobs to monitor or intervene in run-away jobs select No. If you wish to debug short-lived job steps selecting Yes will suspend the job step program until a debugger attaches to the port number. The job will wait indefinitely (up until the Elapsed Time restriction set for the EBP class).
Note: You can also set these remote debugging configurations with the Config Web Service. See the EBP, JCL and Scheduler forum for details on issuing Web services to EBP.
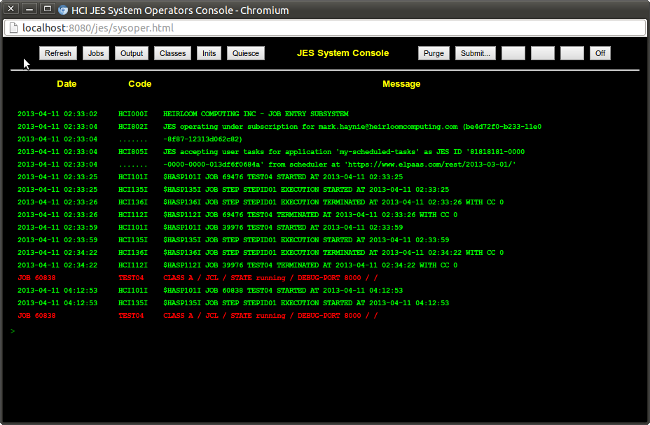
When jobs are running you can see the actual port number assigned to them with the List Web service or by using the Jobs button in system EBP System Console. The display will show the job name and number and the status such as,
CLASS A / JCL / STATE running / DEBUG-PORT 8000 / /
Fig. 18.
To attach to a job whether it is suspended or executing at normal speed, use the Run > Debug Configurations menu item from Eclipse. Scroll down and select Remote COBOL Application and create a new Debug Configuration with the host name and port number.
Fig. 19.
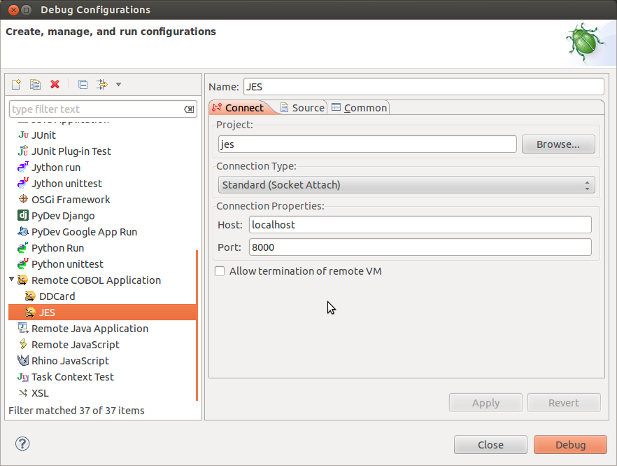
Hit the Debug button to begin debugging.
Note: Suspended jobs will begin immediately after the remote debugger attaches to your program. You should set breakpoints near the start of your COBOL program prior to attachment so you can get control of your debug session.
Example Debug Session
A COBOL program running under IKJEFT1B within a EBP job step is debugged remotely in the following video:
https://drive.google.com/file/d/0BwRpN-DJhp9YT3oyR1N1YVRfaFk/edit?usp=sharing
The same COBOL program being debugged locally (without running under EBP but still initiated by IKJEFT1B) is shown in the following video:
https://drive.google.com/file/d/0BwRpN-DJhp9YQkZsZWtpR1dfTTA/edit?usp=sharing
0 Comments